Kernel bugfixing & new monitoring application 2015/09/29, 20:00:00
Lately I had some issues where the PS2 driver process froze for unrecognizable reasons. And it didn't freeze all the time - only when you did a quick series of command inputs. This led to a nice and long debugging time: the process did not hang in userspace, so it was obviously a problem in the kernel. There weren't many changes in the kernel API before, except... well, the new variable messaging implementation.
When a variably sized message is sent, the kernel looks for inside a map that contains the message queue head for the target process where the message will be inserted. When a process dies, it had inserted NULL into that map. And well, the next time accessing the map, it accessed a null pointer and things went weird.
Whats the lesson? Use assert or add checks everywhere you feel sure that this pointer points to a valid value now. You definitely don't want this kind of bugs. But if you have them, you might like my solution.
Monitoring application
So how did I find the cause of this. Well, when a process blocks, there is an instance of a so-called "waiter" attached to its structure. This waiter tries to do a specific operation (in this case, sending a message) each time the process would be scheduled. There are no kernel threads in Ghost, so they are all compressed to operations as small as possible that happen between two timeslices. The bug was in the routine that handled the sending, so the waiter would wait forever to send the message.
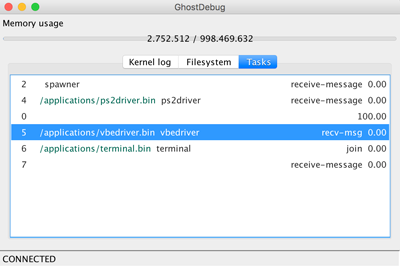
To get a monitoring application to see what process does what (kind of task manager you know from Windows, but outside of the kernel). This application (written in plain Java) connects to the TCP socket that QEMU can expose and that is internally linked to the COM1 port of the virtual machine. Like this, I can simply read bytes that are written from the kernel to COM1, and read bytes that I send there via the socket. I then defined a small protocol, that allows the kernel to send events. These events for example happen when a task is put to sleep (a waiter is appended). The task status is then updated and you can see it in the task area of the monitoring tool.
The tool also shows what filesystem nodes are cached in the kernel, what process uses how much CPU, and some other nice things. When the tool is a little more advanced (and the code erfined), I might make it more generic, I think other developers could profit of it too.
A little rudimentary by now, but you should get the idea. :-) This view for example shows the list of running threads, their binary source and their CPU usage (id 0 is the idle thread):

Comments
Write a comment...No comments